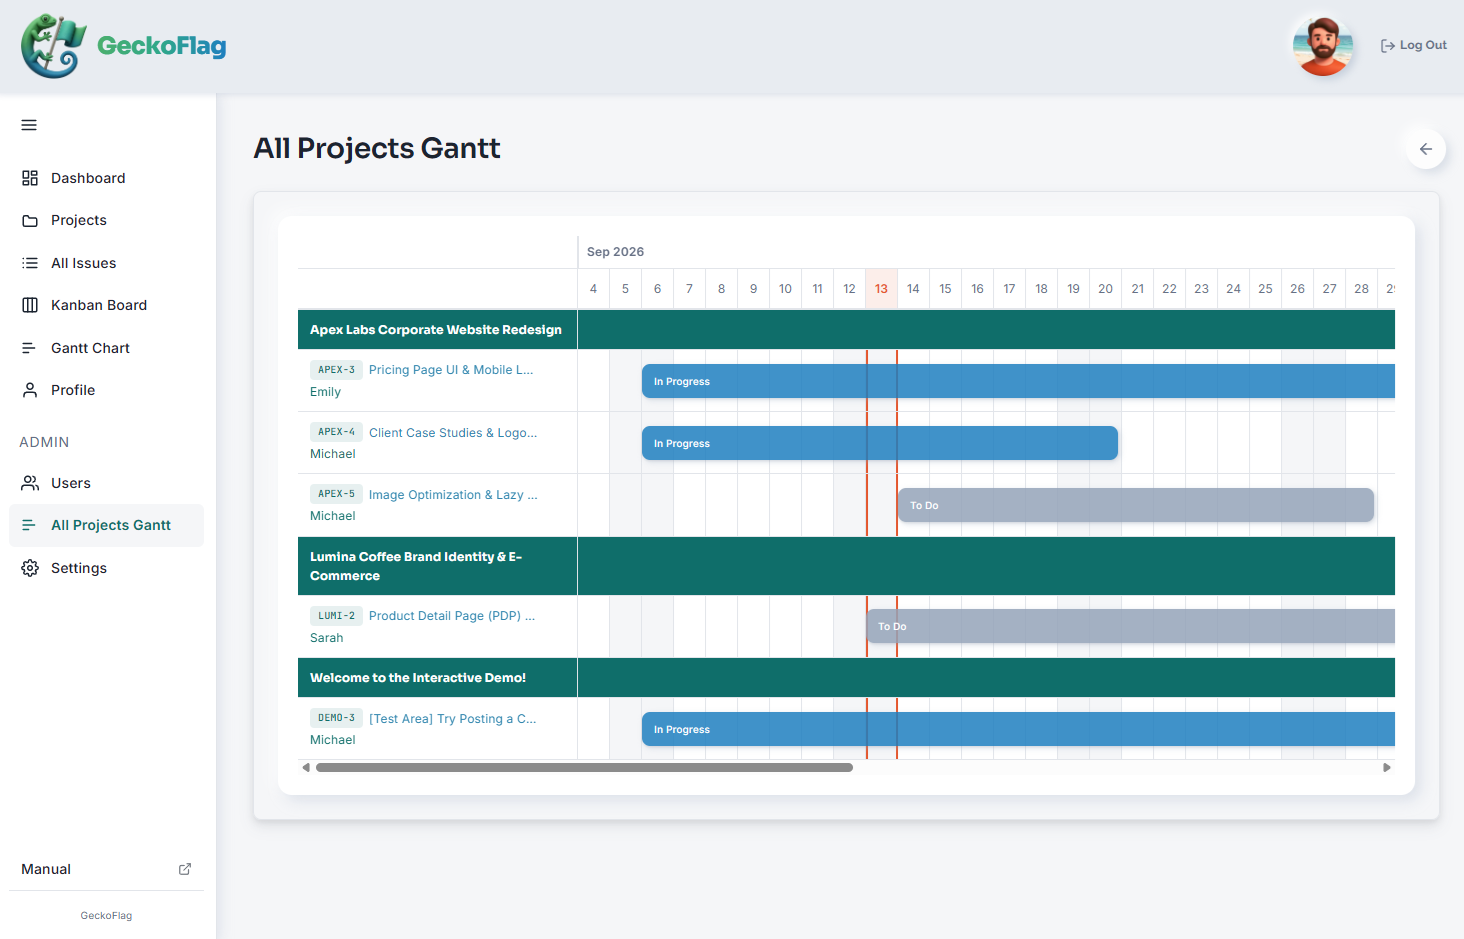
GeckoFlag's Gantt chart lets you visualize your project schedule as a timeline, so you can see task progress and dependencies at a glance.
Key Capabilities
- Gantt chart view — view your project schedule as a Gantt chart.
- Visual timeline — see each task's start and end dates laid out on a timeline, making the overall schedule easy to grasp intuitively.
- Dependency tracking — see how tasks relate to each other, making it easier to understand how a delay in one task affects the rest.
- Progress at a glance — check how the overall schedule is progressing directly from the Gantt chart, without switching views.
Benefits of the Gantt Chart
Visualizing your schedule as a timeline helps you catch delays or overlooked priorities earlier, making it easier to keep track of overall progress even when you're juggling multiple projects.
Back to Features